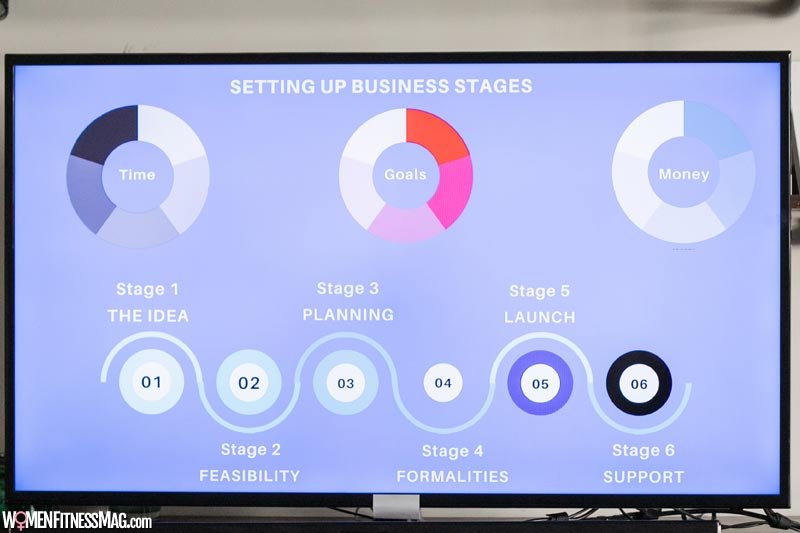
Creating Effective Donut Charts for Data Visualization
Creating Effective Donut Charts for Data Visualization : In an ever-increasing data-centric world, it’s essential to represent information clearly and understandably. Donut charts are incredible tools for data visualization that offer a visually engaging and straightforward method to depict percentages or proportions as parts of a whole.


